04
June 2024
Renergen released its summary of financial statements for the year ended 29 February 2024 on 8 May 2024.

Vaughan Henkel
Head of Securities Solutions, PSG Wealth
Analyst recommendation
Sell
| Counter | Share price | Intrinsic value | Upside/downside |
| REN-ZA | R10.35 | R7.8 | 25% upside |
As at 04 June 2023
Executive Summary
Renergen released its summary of financial statements for the year ended 29 February 2024 on 8 May 2024. We note the below highlights and remaining concerns:
- Even though revenue increased by 128% and gross profit by 151% the loss for the year increased by 311% from R26.7 million to R109.8 million. This is due to expenses ramping up quicker due to less capitalisation and increases relating to higher operational activities. The increase in revenue and gross profit is due to the ramp up of Phase 1 even though operational challenges were experienced.
- A 5.5% stake in Tetra4 (main assets and operations of Renergen) was sold to Mahlako Gas Energy (MGE) for R550 million. This was to settle the Standard Bank bridge loan and to meet the cash flow demand of Phase 2 construction. The $795 million debt financing has been secured which is subject to the completion of the equity capital raise expected in the form of an IPO on the Nasdaq.
- The second half of the financial year experienced operational challenges resulting in annual maintenance being carried out in September instead of December with a prolonged duration due to long lead times of components. The LNG plant was therefore not operational from September until February. A leak in the helium cold box also caused delays in the production of liquid helium and with no sales being recorded in the financial year reported.
- We hope to see details soon regarding the Nasdaq listing due to it being a crucial funding requirement and creating a risk of potential share dilution. As per the 8 March 2023 circular, the listing was expected to occur during the third or fourth quarter of 2023. The notice of the annual general meeting and integrated report is scheduled to be distributed on 28 June 2024, we hope to see more information regarding the listing.
Analyst thesis
- The company has access to a unique asset through its higher than peers’ concentration helium reserves combined with plans for material future growth.
- Currently, we see the price as expensive considering the material risks which include: a. The complexity of exploration and development of gas fields (operational risks) with operational success becoming crucial as debt gets utilised (debt covenants).
- The capital intensiveness of exploration and development of gas fields requires significant capital with the risk of dilution enhanced with the current lower share price.
- Catalysts of operational success or maximum production capacity can only be verified by FY27.
- The going concern risk regarding management’s main assumption depends on obtaining the relevant funding and successfully completing phase 2.
- Steps towards completing management’s EBITDA guidance of between R5.7 billion and R6.2 billion (not expected before the financial year 2027), would serve as potential catalysts and would increase our bull case probability (currently 10% on the bull case). These include a. Obtaining the required financing without material dilution or costs while meeting debt covenant requirements. (R1 billion from the sale of a 10% stake in Tetra4 and $150 million (R2.6 billion) share issue with our expectation now pushed out to FY25. A $260 million (R5 billion) share issue is expected during the 3-year construction period). b. Providing evidence to reach the guided phase 2 production volumes of 4 200 kg per day of LHe and 34 400 gigajoules (GJ) per day of LNG (estimated 2027 calendar year). c. Realising LHe prices of $600 per MCF and LNG of R250 per GJ, having had no adverse exchange rate movements and storage, distribution and dispensing costs not being material.
Results
Table 1: Results summary
| Metric (billion) | 1H22 | 1H23 | Y/Y (%) |
| Net interest income | 33.5 | 37.7 | 12.6 |
| Non-interest income | 23.7 | 26.4 | 11.4 |
| Cost-to-income ratio | 52.4 | 50.7 | -1.7 |
| Net income | 15.7 | 18.0 | 14.6 |
| Deposits | 1 645 | 1 793 | 9.0 |
| Net loans | 1 305 | 1 448 | 10.9 |
| Credit-loss ratio (bps) | 65 | 74 | 9 |
| ROE (%) | 20.1 | 21.8 | 1.7 |
| CET1 (%) | 13.6 | 13.2 | -0.4 |
Source: Sources: FactSet and company financials
Valuation
Table 3: Valuation
Table 6: Valuation multiples
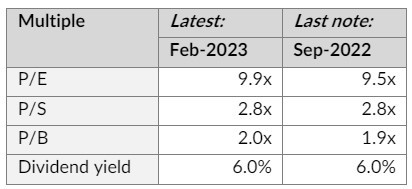
Source: FactSet
Graph 5: FSR Price Momentum
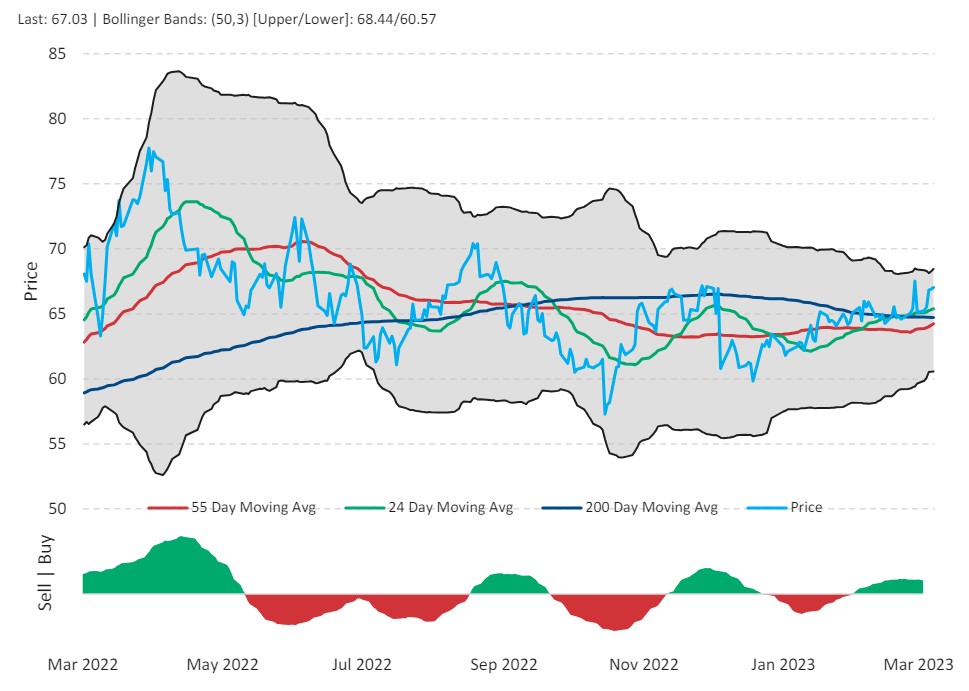
Source: FactSet