30
July 2026
Online funds’ performance for the quarter ended 30 June 2026

Adriaan Pask
Chief Investment Officer, PSG Wealth

IM Online funds’ – performance and positioning
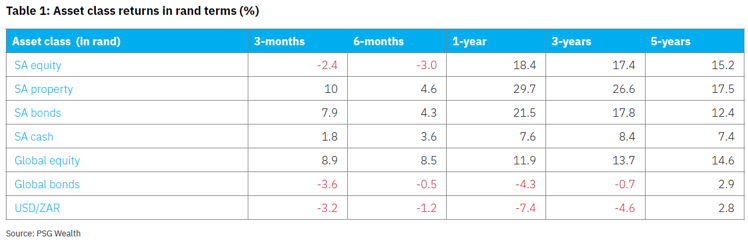
The second quarter of 2026 delivered broad gains across global markets. In rand terms, global equities delivered a return of 8.90%, while global bonds declined by 3.61%. Among regional equity markets, Japan led the equity rally with the Nikkei 225 gaining 27.64%, followed by emerging markets returning 18.80%. US equities rose 10.30%, European equities climbed 9.41%, and UK equities were broadly flat at 0.30%. Global listed property returned 3.31% for the quarter. On a 12-month basis, Japan increased by 43.05%, as emerging markets surged 32.35%, and UK equities advanced by 10.40%.
South African assets produced mixed returns in 2Q26. The JSE All Share Index fell 2.36%, weighed down by a soft June 2026 that marked the index’s second consecutive monthly decline, with the FTSE/JSE Capped All Share Index slipping 3.68%, bringing it to a 2.80% decline for the first half of the year (H1). The steepest drag came from precious metals miners, which alone erased roughly 4.5 percentage points from the index after gold retreated 12% in June. Naspers and Prosus also weighed on performance, with a combined drag of 4%. Offsetting some of the weaknesses, financials rose 2.62% in June and 8.20% over the quarter, while listed property gained 10.03% in 2Q26.
Table 1: Asset class returns in rand terms (%)
Domestic funds’ performance and positioning
Table 2: Fund performance versus sector average
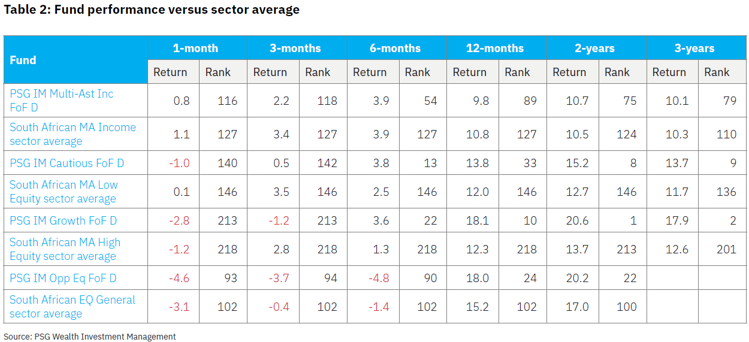
Absolute returns across the multi-asset solutions were mixed for 2Q26. The Multi-Asset Income FoF and the Cautious FoF delivered positive returns of 2.17% and 0.51% respectively. In contrast, the Growth FoF declined by -1.15%. The equities building block was the largest detractor from performance as risk assets came under pressure. At a sector level, resources weakened the most from returns over the quarter, while financials and industrials each contributed positively. All five of the building blocks’ largest detractors were resources holdings: Thungela Resources, Gold Fields, AngloGold Ashanti, Sasol and Northam Platinum. The largest contributors were split between industrials, including Anheuser-Busch InBev SA/NV, MTN and Aspen, and financials such as FirstRand and Discovery Ltd. The cash and fixed income building blocks provided support, as our underlying managers were well rewarded for tactically rotating out of the belly of the yield curve.
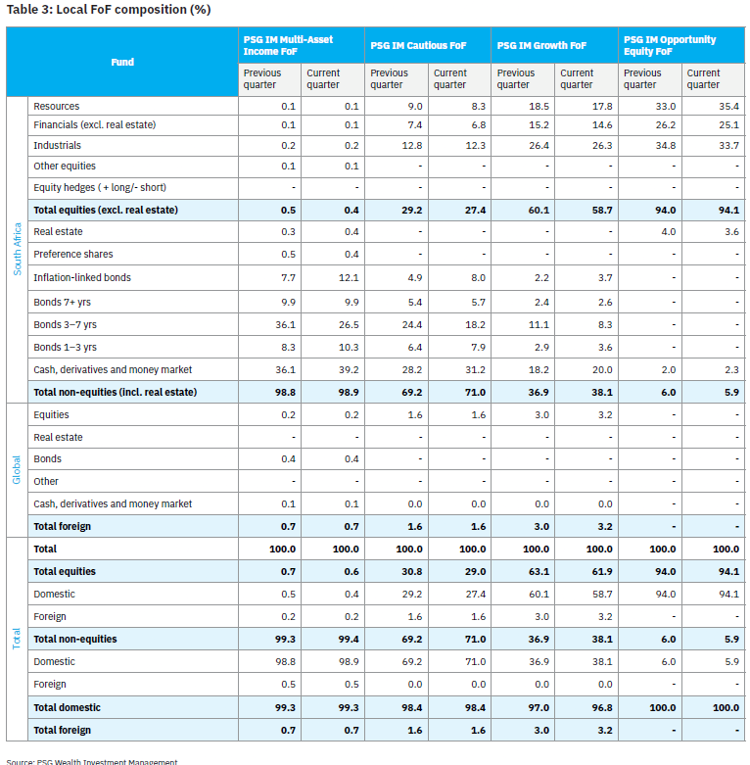
At a fund of funds level, the aggregate effect of underlying manager activity in the MA Income FoF this quarter was a rotation out of medium-dated bonds. Bonds in the three- to seven-year range were trimmed by 9.6 percentage points, with the proceeds being deployed into inflation-linked bonds (+4.5 percentage points), cash and money market holdings (+3.1 percentage points), and bonds in the one- to three-year range (+2.0 percentage points). In the Cautious FoF, bonds in the three- to seven-year range were trimmed by 6.2 percentage points, with the proceeds being deployed into inflation-linked bonds (+3.1 percentage points) and cash and money market holdings (+3.0 percentage points). Exposure to resources and financials declined by 0.7 and 0.6 percentage points respectively. In the Growth FoF, bonds in the three- to seven-year range were trimmed by 2.8 percentage points, with the proceeds being deployed into cash and money market holdings (+1.8 percentage points) and inflation-linked bonds (+1.4 percentage points). Exposure to resources and financials declined by 0.7 and 0.6 percentage points respectively.
The PSG IM Opportunity Equity FoF lagged its benchmark by 3.3 percentage points over the quarter, as domestic risk assets derated. The fund remains ahead of benchmark over 12 months (+2.8 percentage points) and two years (+3.2 percentage points). At a sector level, our underlying managers on aggregate added 2.4 percentage points to their resources exposure, funded by reductions in financials and industrials of 1.1 percentage points each, as well as deployment of cash. At a fund of funds level, no changes were made to the composition over the quarter.
Table 3: Local FoF composition (%)
PSG IM Global Flexible Fund of Funds
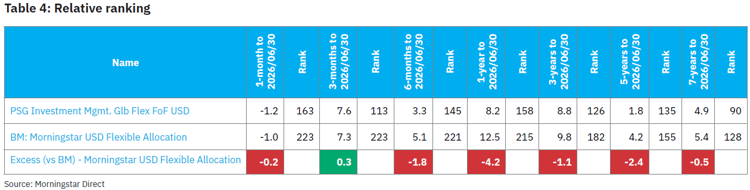
The Global Flexible Fund of Funds returned 7.63% over 2Q26, outperforming the sector average of 7.33% by 0.3 percentage points. HSBC Global Strategy Dynamic was the top performer, adding 6.10% in alpha. Also supporting returns were Baillie Gifford, adding 4.90% in alpha, and Sarasin, also contributing positively with 2.40% in alpha over the quarter. MFS Meridian Prudent Capital was the main detractor. Overall, the composition of the Global Flexible FoF remained unchanged over the quarter
Table 4: Relative ranking